Getting down to the business of IT with vRB
Saurabh Chandratre
1. Introduction
VMware vRealize Business (vRB) is available as part of the vCloud and vRealize suites and provides a business context to the services IT offers. It helps organisations shift from a technology orientation to a service broker emphasis and provides transparency and control over the cost and quality of IT services. It extends the vRealize suite to business stakeholders and provides a fact based approach to key challenges and the age old business need to minimize the cost of IT while maximising the value IT delivers to its customers.
This blog is the result of work undertaken whilst delivering a PoC for a medium sized organisation and outlines the capabilities and functionality of vRB.
2. Challenges Faced by the Manager of Cloud Operations
The manager of cloud operations in an organisation is constantly faced with a number of challenges regarding cost visibility and optimisation in the delivery of Infrastructure as a Service (IaaS), including:
- What is the total spending and what is it comprised of?
- What is the cost of delivering a unit of IaaS?
- Who consumes these services and at what cost?
- What are these services used for and what is the cost allocation for each?
- How is my cost efficiency compared to that of other public cloud infrastructures?
- What is the cost of potential alternatives to delivering IaaS?
- How do I use the information above to optimize the cost of my existing and future operations?
- How do I create an accurate showback report to show it to the stakeholders
3. Business Management for Cloud
vRB is all about the business management of your IT and cloud infrastructure, but what does it really do?
- Provides cost and usage visibility of virtual infrastructure/private cloud and public cloud with out of the box integration with VMware vCenter Server, vRealize Automation, vCloud Director, vCloudAir, Amazon Workspace Services (AWS), and Azure.
- Performs what-if analysis of virtual infrastructure/private cloud and public cloud, based on cost and utilization.
- Automatically prices the services available through self-service in a hybrid cloud.
- Provides out of the box benchmarks for cloud / virtual infrastructure environments, providing insight into capacity, costs and efficiency.
- Delivers common reporting and usage metering coverage for measuring, analysing, reporting and invoicing based on usage across private and public cloud.
4. vRB Categories
The information reported on in vRB falls into the following categories:
**
Total Cloud Cost **
Displays the total cost of running a cloud per month.
Operational Analysis
Displays the estimated average cost of the virtual machines for the current month based on its utilization for last 30 days.
Demand Analysis
Displays the number of virtual machines that are used over a period of time. This analysis is useful for tracking the demand for virtual machines for planning.
Cost Drivers
Displays the distribution of cost breakdown for your cloud environment in terms of cost drivers. The cost drivers are Server Hardware, Storage, OS Licensing, Maintenance, Labour, Network, Facilities, and Additional Costs. For more information about viewing and editing cost drivers
Cloud Resources
Displays the estimated cost breakdown for a virtual machine in terms of CPU, memory, storage, and operating system license and labour cost based on last 30 days.
Demand Allocation
Displays how the allocated costs are spread across different consumer groups of virtual machines. This widget displays only the top consumers of virtual machines in terms of cost.
Capex/Opex
Displays the total capital expenditure and operating expenditure incurred for your private cloud. Allocation Displays the estimated costs for allocated and unallocated resource types (CPU, memory, and storage) over the month.
Demand Largest Changes
Displays the category where the largest change in the cost has occurred month on month. The list is ordered by descending order of change in cost. The widget also provides an idea as to which top level consumer has the highest month on month increase or decrease in IT cost consumption.
5. vRB Standard Dashboard
In this section, I’ll go through the standard dashboard and highlight the areas covered and what you’ll see on screen.
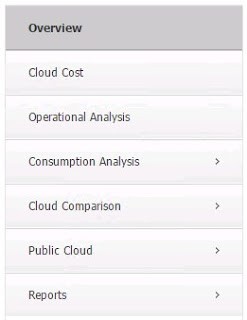
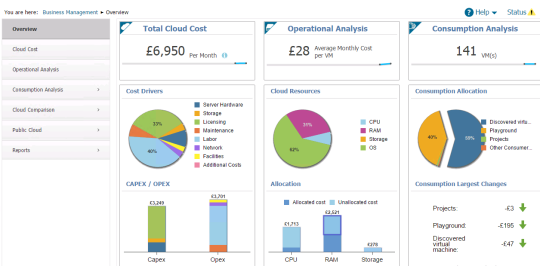
5.1 Overview Tab
The overview dashboard consists of
- Total Cloud Cost
- Operational Analysis
- Consumption Analysis
5.1.1 Cloud Cost Tab
vRealize Business Standard categorises the cost drivers into Server Hardware, Storage, OS Licensing, Maintenance, Labour, Network, Facilities and Additional costs.
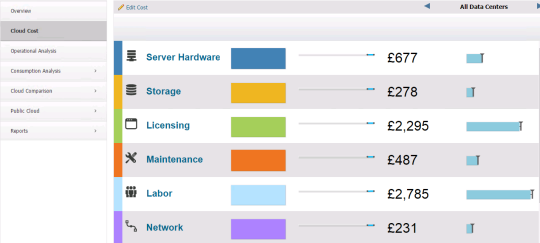
Cost Drivers
vRealize Business Standard categorizes the cost drivers into Server Hardware, Storage, OS Licensing, Maintenance, Labour, Network, Facilities, and Additional Costs. The cost driver data that you provide is the monthly cost except for the server hardware cost and storage array hardware cost.

Server Hardware
Displays the server cost information by CPU age. For complete cost information related to server hardware,
Storage
Displays total cost of data store (for each storage type or storage profile) and the storage arrays. You can select Datastores and Storage Hardware to view its respective storage cost details. The data store cost is the cost of the data stores that are not part SRM EMC storage array.
OS Licensing
Displays the operating systems cost distribution of your cloud environment. For complete cost information related to OS licensing, For Non-ESX physical servers, VMware license is not applicable.
Maintenance
Displays the maintenance cost distribution for the server hardware and OS maintenance. For complete cost information related to maintenance,
Labour
Displays the labour cost distribution for the servers, virtual infrastructure, and operating system. For complete cost information related to labour, For physical servers, operating system labour cost and servers labour costs are applicable, virtual infrastructure cost is not considered.
Network
Displays the networks costs by NIC type. For complete cost information related to network,For physical servers, the network details are not captured. So, the network cost is considered as zero.
Facilities
Displays the facilities costs distribution according to rent, real estate, power, and cooling. For complete cost information related to facilities
Additional Costs
Displays the additional costs details such as backup and restore, high availability, management licensing, VMware software licensing.
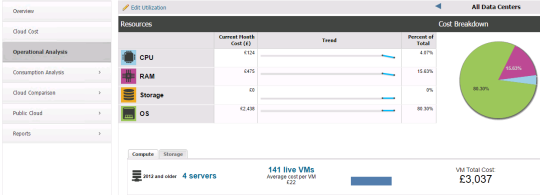
5.1.2 Operational Analysis Tab
The operational analysis considers the CPU, RAM, and storage as first class components of the cloud infrastructure. The Resources table under the Operational Analysis tab displays cost breakdown information in terms of the current month cost, trend, and total percentage value of CPU, RAM, storage, operating system (license and labour) consumption in your cloud environment. You can filter the resource cost information, its generation details and virtual machine cost based on each data centre or view all data centres cost information together, by using the All Data Centres drop-down list.
5.1.3 Consumption Analysis
The consumption analysis determines who consumes the resources, the purpose of which they are consumed and the cost associated with the resources.
Consumption overview
is a dashboard that shows the monthly cost, budget and charge of the virtual machines.

Monthly Cost:
the total monthly cost of all virtual machines, which includes cost of the RAM, CPU, storage and OS.
Monthly Budget:
the budget allocated to that consumer. Budget is the expected limit on charge consumption that is allocated to each consumer.
Monthly Charge:
the monthly charge of all virtual machines. Charge is calculated on the capacity allocated to the virtual machines.
Consumed Capacity:
the total charge split into RAM, CPU and storage charges. It also displays trend of total number of running virtual machines per month.
Over/Under Budget:
compares budget and charge per consumer at monthly and yearly intervals. The graph displays the top three consumers whose charge has deviated from budget. The deviation can be the charge either exceeding or close to the budget.
Cost/Charge:
compares cost and charge for each consumer at monthly and yearly interval. The graph displays the top three consumers having the highest charges.
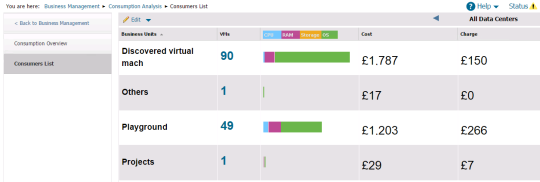
Consumers list is an overview of how costs are allocated and the budget and costs over time.

Top Consumers:
displays how the allocated costs are spread across different consumer groups of virtual machines. This also displays the top three consumers of virtual machines in terms of cost and remaining consumers are grouped under others.
**Over/Under Budget over time: **
compares the total charge and total budget. In the widget, the bars graph represent charge, the line graph represent the budget.
Cost/Charge over time:
compares the total cost and total charge. In the widget, the bars in the graph represent cost, the line graph represent the charge.
5.2 Cloud Comparison tab:
You can view the cost of virtual machines in your private cloud and then compare it with the pricing models for Amazon Web Services, Windows Azure, and vCloud Air public cloud.
vRealize Business Standard estimates the costs of running a completely new instance or an existing instance of a virtual machine in the private cloud by using the cost drivers of your private cloud, and then provides you with a comparison of the cost of the same configuration in Amazon Web Services, Windows Azure, and vCloud Air cloud models.

5.3 Public Cloud tab:
vRealize Business Standard integrates with vCloud Air, AWS and Windows Azure and provides detailed analysis of the bills. vRealize Business Standard provides the users an overview of how their investments are spread across vCloud Air, Amazon Web Services (AWS) and Windows Azure.

5.4 Reports tab:
You can generate reports from vRealize Business Standard to get cost details of vCenter Server, vCloud Director, vRealize Automation, and virtual machines of the public cloud. This information can be exported to a suitable format

6. Finding out more about vRB
vRealize Business is available as Standard, Advanced & Enterprise versions. A comparison of the features can be found here:
http://www.vmware.com/products/vrealize-business/compare.html
For more information on vRB, see the links below:
http://www.vmware.com/uk/products/vrealize-business
http://pubs.vmware.com/vrealizebusinessstd-6.0/index
If you’d like any assistance with a VMware vRealize project or want to learn how it can work for your organisation,
and we’ll be more than happy to use our real world experiences to support you.
About the Author
Saurabh Chandratre joined the Xtravirt consulting team in March 2015, his specialist areas include VMware Virtualisation product sets, Microsoft Server Technologies and solutions and EMC storage technologies. He is certified in the delivery of the VMware vRealize Business Management Suite.